Chromatographic systems used in Pharmaceutical Laboratories
- Published on: Mar 22, 2021
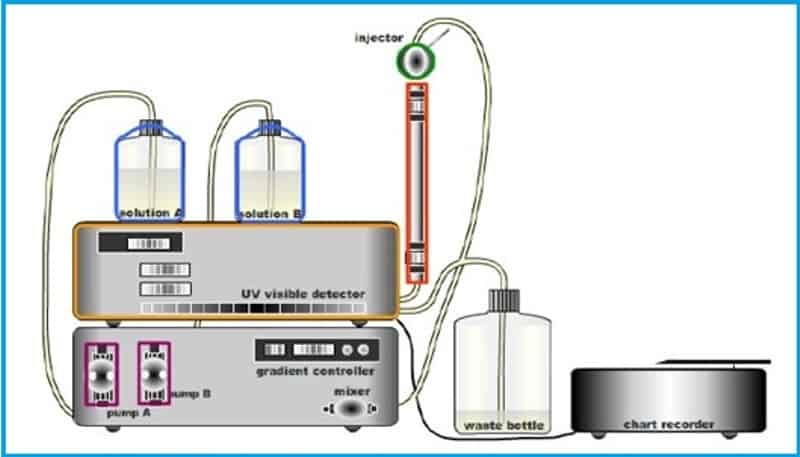
High Performance Liquid Chromatography
Important HPLC components and parameters systems
To optimize HPLC system operation, control and document the following components, variables and parameters:
1. Column parameters and performance
2. System suitability testing
3. Preparation of mobile phase
4. Preparation of samples
5. Columns and guards
6. Injectors
7. Pumps
8. Detectors
9. FDA Guidance Documents:
10. FDA· Chromatography
11. FDA -Method validation
Mobile Phase
The mobile phase in HPLC refers to the solvent being continuously applied to the column, or stationary phase. The mobile phase acts as a carrier for the sample solution.
The mobile phase in HPLC refers to the solvent being continuously applied to the column, or stationary phase. The mobile phase acts as a carrier for the sample solution. A sample solution is injected into the mobile phase of an assay through the injector port. As a sample solution flows through a column with the mobile phase, the components of that solution migrate according to the non-covalent interactions of the compound with the column. The chemical interactions of the mobile phase and sample, with the column, determine the degree of migration and separation of components contained in the sample.
For example, those samples which have stronger interactions with the mobile phase than with the stationary phase will elute from the column faster and thus have a shorter retention lime, while the reverse is also true.
The mobile phase can be altered in order to manipulate the interactions of the sample and the stationary phase. There are several types of mobile phases, including isocratic, gradient, and polytyptic.
210 SOPs, 197 GMP Manuals, 64 Templates, 30 Training modules, 167 Forms. Additional documents included each month. All written and updated by GMP experts. Checkout sample previews. Access to exclusive content for an affordable fee.
Detectors and Detection Limits
The detector for an HPLC is the component that emits a response due to the eluting sample compound and subsequently signals a peak on the chromatogram. It is positioned immediately posterior to the stationary phase in order to detect the compounds as they elute from the column.
The detector for an HPLC is the component that emits a response due to the eluting sample compound and subsequently signals a peak on the chromatogram. It is positioned immediately posterior to the stationary phase in order to detect the compounds as they elute from the column. The bandwidth and height of the peaks may usually be adjusted using the coarse and fine tuning controls, and the detection and sensitivity parameters may also be controlled (in most cases).
There are many types of detectors that can be used with HPLC. Some of the more common detectors Include: refractive Index (RI), ultraviolet (UV). Fluorescent, radiochemical, electrochemical, near-infrared (Near-JR), mass spectroscopy (MS).nuclear magnetic resonance (NMR), and light scattering (LS).
RI detectors measure the ability of sample molecules to bend or refract light.
UV detectors measure the ability of a sample to absorb light. UV detectors have a sensitivity to approximately 10-8 or 10-9 g/ml. This can be accomplished at one or several wavelengths:
1. Fixed wavelength measures at one wavelength (usually 254 nm)
2. Variable wavelength measures at one wavelength at a time. but can detect over a wide range of wavelengths
3. Diode array measures a spectrum of wavelengths simultaneously
Column (Stationary Phase) and Column Guards
The stationary phase in HPLC refers to the solid support contained within the column over which the mobile phase continuously flows. Column efficiency refers to the performance of the stationary phase to accomplish particular separations.
Injectors
Samples are injected into the HPLC via an injection port. The injection port of an HPLC commonly consists of an injection valve and the sample loop.
Samples are injected into the HPLC via an injection port. The injection port of an HPLC commonly consists of an injection valve and the sample loop. The sample is typically dissolved in the mobile phase before Injection into the sample loop. The sample is then drawn into a syringe and injected into the loop via the injection valve. A rotation of the valve rotor closes the valve and opens the loop in order to inject the sample into the stream of the mobile phase. Loop volumes can range between 10 μl to over 500 μl. In modern HPLC systems, the sample injection is typically automated.
Stopped-flow injection is a method whereby the pump is turned off, allowing the injection port to attain atmospheric pressure. The syringe containing the sample is then injected into the valve in the usual manner, and the pump Is turned on. For syringe type and reciprocation pumps, flow in the column can be brought to zero and rapidly resumed by diverting the mobile phase by means of a three-way valve placed in front of the injector. This method can be used up to very high pressures.
HPLC Pumps
There are several types of pumps available for use with HPLC analysis: reciprocating piston pumps, syringe type pumps, and constant pressure pumps.
Reciprocating piston pumps consist of a small motor driven piston that moves rapidly back and forth in a hydraulic chamber that may vary from 35-400 μl in volume. On the back stroke, the separation column valve is closed, and the piston pulls in solvent from the mobile phase reservoir. On the forward stroke, the pump pushes solvent out to the column from the reservoir. A wide range of flow roles can be attained by altering the piston stroke volume during each cycle, or by altering the stroke frequency. Dual and triple head pumps consist of identical piston-chamber units which operate at 180 or 120degrees out of phase. This type of pump system is significantly smoother because one pump Is filling while the other is in the delivery cycle.
Syringe type pumps ore most suitable for small bore columns because this pump delivers only a finite volume of mobile phase before it has to be refilled. These pumps have a volume between 250 to 500 ml. The pump operates by a motorized lead screw that delivers mobile phase to the column at a constant rate. The rate of solvent delivery is controlled by changing the voltage on the motor.
In constant pressure pumps, the mobile phase is driven through the column with the use of pressure from a gas cylinder. A low-pressure gas source is needed to generate high liquid pressures. The valving arrangement allows the rapid refill of the solvent chamber whose capacity is about 70 ml. This provides continuous mobile phase flow rates.
Column Parameters and Performance
The following LC column parameters should be defined in the test method:
Important column parameters:
1. Dimensions: length, inner diameter
2. Frit size
3. Filter type
4. Pre-column and/or guard column type, if used
Packing material:
1. Particle type: size, shape, pore diameter
2. Surface modification (e.g. bonded surface type, surface coverage, percent carbon, additional silylation)
3. Recommended pH range for column use
Preparation of Samples
Selection of the appropriate solvent phase is dependent on the solubility of the drug in question. Where possible, the sample should be dissolved in the mobile phase to avoid generation of extraneous peaks or peak broadening.
If pure solvents like methanol, ethanol and acetonitrile are used for extraction, a final dilution of1 to 5 or 1 to 10 of the extract should preferably be made with the mobile phase. Final filtration of solutions through an appropriate filler may be indicated prior to injection.
Typical specifications for HPLC/GC settings
Include a table like this in the written method:
Pump | Waters Associates Model 2690 (Alliance) |
Detector | Waters Associates Model 996 Photodiode Array Detector |
Injector | Waters Associates Model 2690 (Alliance) |
Computer | Pentium 133 (or equivalent) |
Software | Waters Associates Millennium 20 I 0, Version 2.15 |
Detector sensitity | Self-adjusting |
Detector wavelength | 240 nm |
Injection volume | 20 μL |
Column | μBandapak C18, 3.9 x 150 mm, 10 μm |
Mobile phase | Phosphate buffer. pH 8.0• Mix 1.3 ml sodium dihydrogen phosphate and 32.5 ml of O.SM disodium hydrogen phosphate dilute to distilled water.• Mix 600 ml ocetonitrile with 400 ml phosphate buffer,• Filler through a 0.45 μm filter and degas prior to use. |
Flow rate | 1.2 ml/min |
Retention time | Product x about 3.0 mins |
HPLC performance checks
The HPLC column performance can be checked by reviewing changes in:
– column efficiency
– capacity factor
– symmetry factor
– analyte resolution
A column performance check should be carried out on a regular basis and be designed to measure chromatographic efficiency, capacity, and symmetry. There are a number of ways to determine column performance and the following procedure describes one such way.
The column performance should be checked once a month and also whenever significant changes in peak shape, resolution or retention time are observed during on analysis. The column performance should be assessed in terms of efficiency, capacity, and symmetry and the records together with the actual chromatograms should be property maintained.
If more than one high pressure liquid chromatograph is available in a laboratory, initial and subsequent column calibrations should be carried out using the same equipment each time. This is important for valid comparisons and the analysis of trends.
Column Efficiency
Column efficiency can be checking the number of theoretical plates per column. As the column degrades or loses efficiency there will be a change in the N value:
N = 5.54 (VR2 / Wh2)
N = number of theoretical plates per column
VR =distance along baseline between point of injection and a perpendicular dropped from the maximum of the peak of interest
Wh = width of the peak of interest of half peak height, measured in some units as YR
Capacity Factor (K’)
k’ = (VR – VO) / VO
VR = distance along the baseline between the point of injection and perpendicular dropped from the maximum of the peak of interest
VO = distance along the baseline between the point of injection and a perpendicular dropped from the maximum of on unretained peak.
Symmetry Factor(F)
Symmetry factor is an indicator of peak skewness. The more skewed the peak the test less reliable the assay.
f=Wx / 2d
Wx=peak width at 5% width height
d=distance between the perpendicular dropped from the peak maximum and the leading edge of the peak of 5% of the peak height.
Analyte Resolution (Rs)
The resolution is a measure of the degree of separation of two adjacent peaks of equal height and width. The better the separation the more reliable the assay.
Rs=2d / ((Wb)B + (Wb)A)
d=distance between maximum of two adjacent peaks
(Wb)B=width at base peak B
(Wb)A= width at base peak A
Mobile phases and sample preparation
Mobile phase:
– Filter through a 0.45 micron filter to protect the column
– Degas e.g. helium sparging, ultrasonic bath under vacuum
– Beware: vacuum can change volatile solvent composition
– Components measured separately
– Avoids volume contraction error
Sample preparation:
– Selection of appropriate solvent phase
– Where possible, use mobile phase
– If pure solvents is used, dilute in the mobile phase
– Filtration prior to injection is often recommended
Sample analysis:
– Sample injection should be “duplicate injections”
– Injections of a standard solution should be repeated regularly throughout the run as part of the SSI program
Injections of all sample solutions should be mode in duplicate. Injections of standard solution should be repeated regularly throughout the run; say, after every group of 3 to 4 samples.
Quantitation
For incompletely resolved peaks, height measurement gives belier respectability.
Selection of standards
For significantly long runs, standard responses either preceding, succeeding, or immediately bracketing a group of samples should be used in calculating the results for that group. This will minimize any errors due to change in detector response with time. However, if the percentage RSD calculated on all the standard responses in an analysis run does not exceed 2% then a mean of oil the standard responses may be used to calculate the results.
If there is a disturbance (negative peak) at the solvent front due to a refractive index change. this should be eliminated using inhibit integration option. otherwise certain data reduction devices may draw a baseline from the top of the negative peak at the solvent front to the base of peak of interest, which would result in erroneous peak area measurements.
The integration parameters such as peak width and noise reduction should be optimized to obtain consistency in the way that integration of the area of the peak of interest is effected, Identical baseline correction codes for the peak of interest printed beside the peak area/height in replicate injections indicate consistency in the method of integration
Spectrophotometric systems
Types of spectrophotometer
Different spectrophotometers operate in different wavelength bonds of the light spectrum:
– UV /VIs spectrophotometer: 200-700nm used for assay and identification
– IR spectrophotometers
– NIR: 12,821·- 4000 cm-1
– FTIR: 4000 – 670 cm-1
Basic principles of spectrophotometer operation
An infrared spectrophotometer is composed of on IR light source a sample container a prism to separate light by wavelength, a detector, and a recorder that produces the IR spectrum.


Typical specifications for a spectrophotometer
These specifications ore usually assured by the instrument vendors.

Typical specifications for spectrophotometer cells
Type of cell | For-UV | Standard UV | UV / Near IR | Visible |
Type 1A | Type 1B | Type 2 | Type3 | |
Spectral range (nm) | 180-2600 nm | 220-2600 nm | 220-3500nm | 360-1000 nm |
Transmittance | 75% at 220nm | 77% at 220 nm | 75% at 220 nm | 85% at 365nm |
85%at 220nm | 85% at 365 nm | |||
87% at 220nm |
Typical IR spectrophotometer calibration tasks
1. Regular performance test – Wavenumber calibration
2. Pre-use check – Pen response (amplifer gain)
3. Monthly for fuse 12 months, then quarterly, after repair or malfunction
– Balance
– to line flatness
– Wavenumber calibration
– Spectral resolution

Author: Kazi Hasan
Kazi is a seasoned pharmaceutical industry professional with over 20 years of experience specializing in production operations, quality management, and process validation.
Kazi has worked with several global pharmaceutical companies to streamline production processes, ensure product quality, and validate operations complying with international regulatory standards and best practices.
Kazi holds several pharmaceutical industry certifications including post-graduate degrees in Engineering Management and Business Administration.
Related Posts
 in GMP 5")
What is Computer System Validation (CSV) in GMP
General Procedure for New Product Registration for Medical Device Site
Line clearance procedure and reconciliation in GMP
 in GMP 5")


